Practical Guide to Navigating the Metaregister
The carbon market is a new and constantly growing market that seeks to address climate change through various tools. One of the most important challenges we face is that in many places it is not yet properly regulated, so it results in an opportunity to improve it; with that in mind, Toroto developed a digital platform that provides traceability and transparency to every purchase and sale of carbon credits, as well as valuable information about the ecosystem in which each forest carbon or regenerative agriculture project is located. This tool combines disruptive technologies and web development to create a graphical interface that consists of a map on which carbon capture projects are located, as well as the carbon credits generated by it. We call this platform the Metaregistration.
In this guide, you can learn how to navigate it. The Metaregistro is a platform developed by Toroto, but designed for everyone.
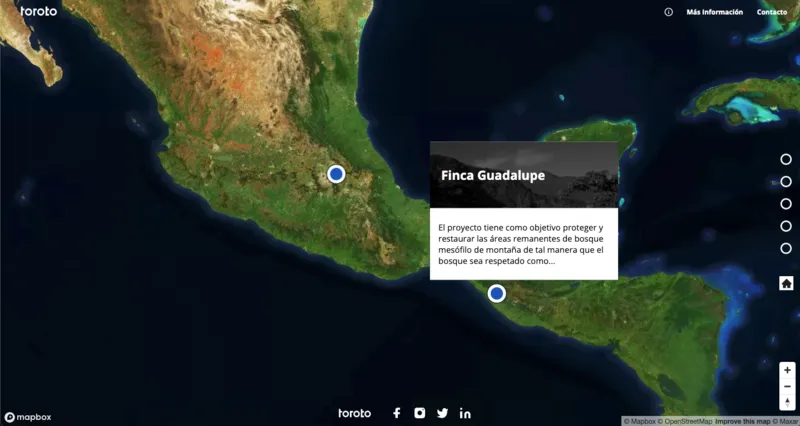
To get to the Metaregistro you must enter Toroto.com and look for the “Metaregistration” section in the upper margin. The first thing you'll find when you open it is a map where you can see the different places in the Mexican Republic where we have forest carbon and regenerative agriculture projects. At the moment there are only projects operated by Toroto, however, if you have an initiative that you would like to upload to the Metaregistro, do not hesitate to contact us to collaborate in building a stronger and fairer carbon market.
Now, how do we navigate this platform?
1. When you place your cursor over any of the blue dots found on the map, you can see what project it is, either regenerative agriculture or carbon capture.
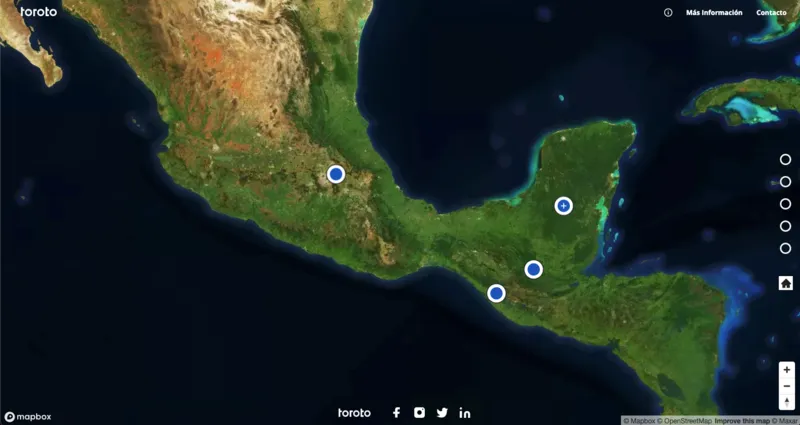
Map of projects in the Mexican Republic
List of projects in the Mexican Republic
2. When you enter any of the projects, the first thing you will see are satellite views in which each hexagon - which we call tiles- represents a carbon bond. On the left side you can find additional information on carbon credits such as:
The incredible thing about this way of presenting information is that with the help of blockchain -a decentralized digital system in which data and every movement of an asset are recorded- We avoid the Double counting and you can see who these bonds belong to. Double counting happens when the same bond was sold to two companies, when it was issued and certified incorrectly or when it is counted twice, which means that one of these companies is not truly neutralizing its carbon footprint and falls into greenwashing. This is a common and widespread challenge in the market.
We are currently working on this section in order to make the visualization of the above as clear and transparent as possible. As a company committed to strengthening the carbon market, at Toroto we want to be equally transparent and for this reason we tell you that very soon you will be able to see every transaction that occurred in each project, however, we wanted to mention it since it is one of the parts that most excites us because it will provide traceability and transparency to every bond transaction that the carbon market needs.
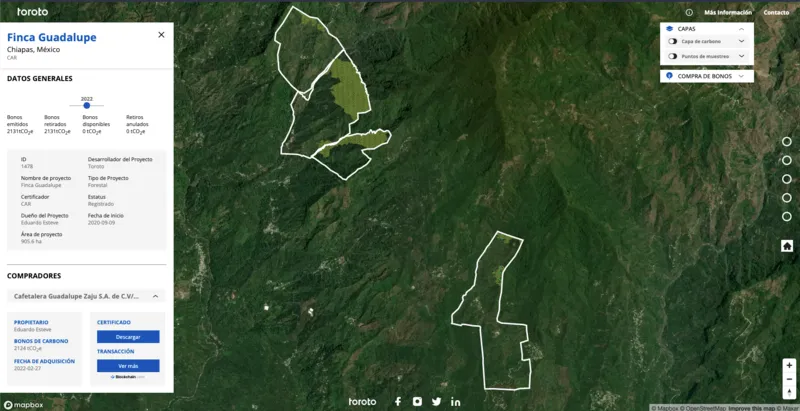
Satellite view of the tiles with additional project information
3. On the other hand, you can find the flora and fauna of each project, its scientific name and if it is endangered or under any category of protection. Knowing this type of information helps us to know how to manage each area, with which native species we have to reforest and gives us a deeper understanding of the complex networks involved in an ecosystem. This can also be useful if you are a biologist or a related career, a company in the environmental sector or with an interest in the conservation and protection of ecosystems, or simply passionate about nature and natural resources, since this section can help you consult local information.

Flora and fauna of the project
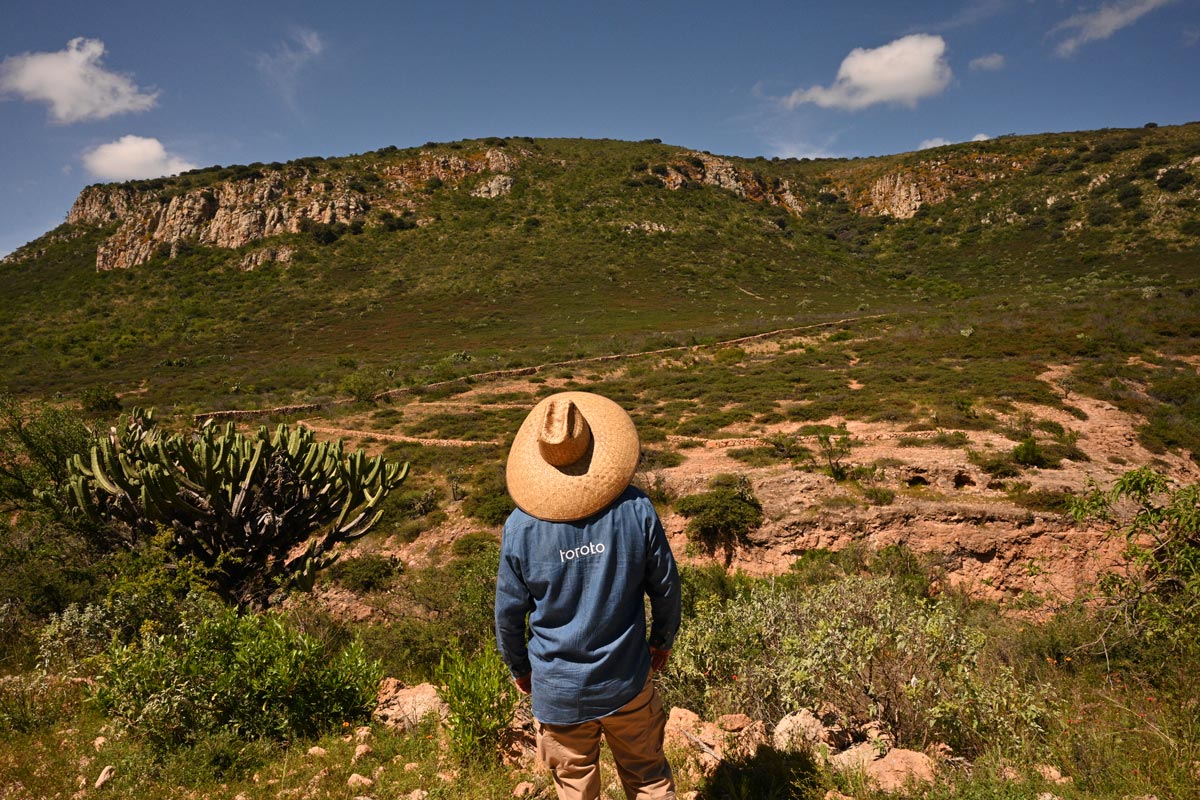
4. As we have said and will continue to reiterate, projects and the correct management of the territory are only possible thanks to the owners of the land, since they know their resources perfectly well and are the ones who will be there for generations to come, transmitting that knowledge and that ideological predisposition towards conservation over time. Our projects not only have an environmental impact, but they also have an equally important social impact, so you can find the Sustainable Development Goals to which each project provides, in the same additional information section.
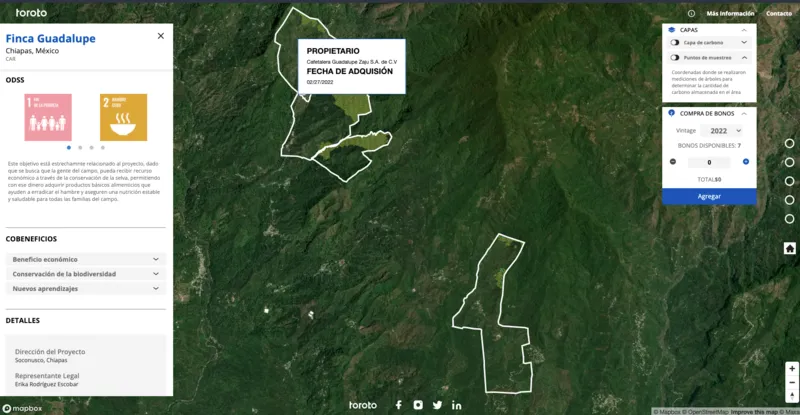
Sustainable Development Goals to which the project contributes
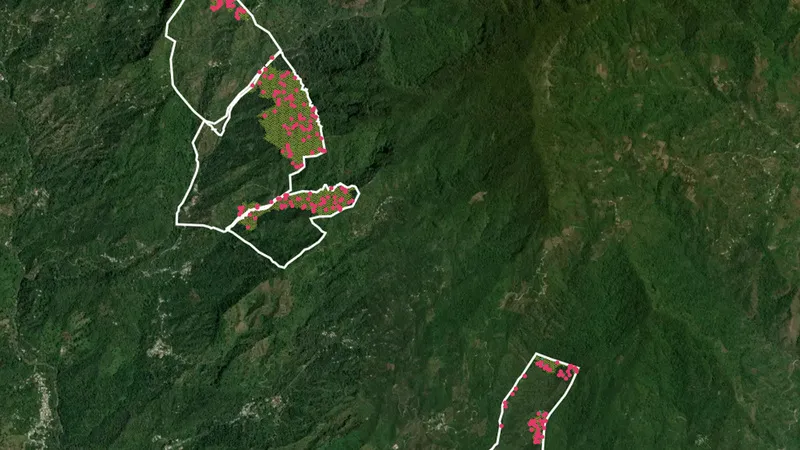
5. When we start each project, we need to do a baseline survey, that is, a measurement that allows us to know how carbon stocks are located in an area of activity and How much additional carbon will be captured from then on. Can you imagine measuring every tree in a forest? Impossible. For this, we choose key sampling points based on the methodology of Climate Action Reserve (EXPENSIVE). We launched a “mesh” of points across the entire project area -each point has a defined radius of 25 m- and then, with a CAR tool, we randomly select these points. As information is collected in specific places, we are updating a statistical analysis that tells us when we have already raised enough points and the information we obtained is significant and representative for the entire area of activity. The number of sample points varies depending on the size of the project. The pink dots you can see on the map are these sample points! You can access that layer of the Metaregistration with the top box on the right side.
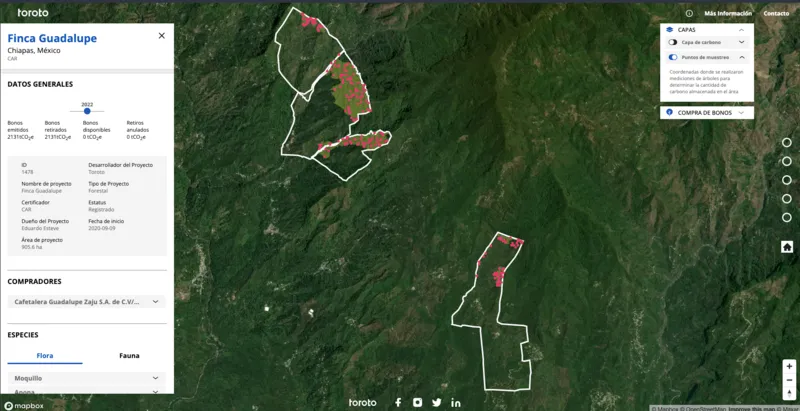
Layer with the sampling points
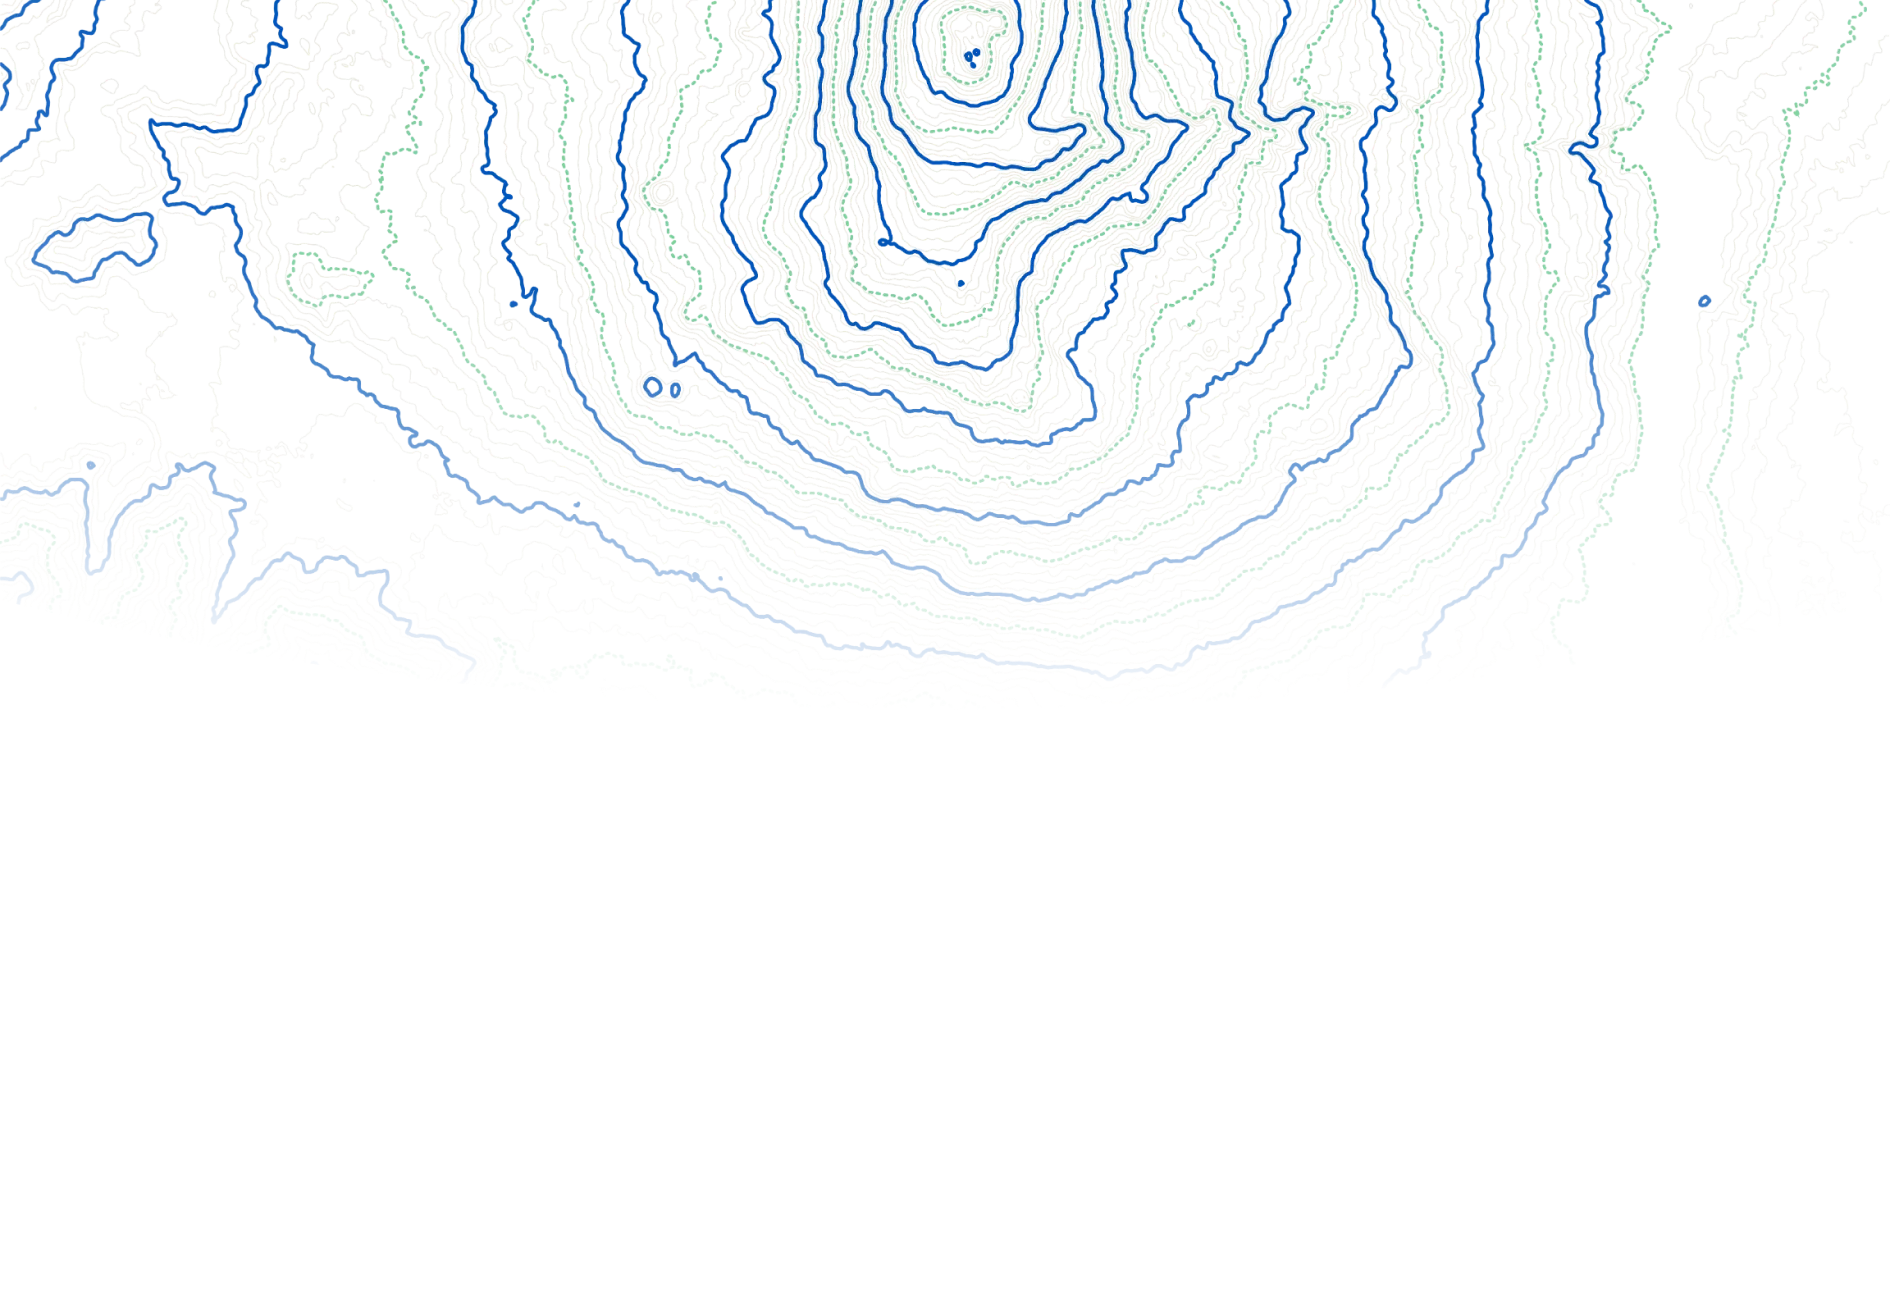
6. Another layer that can be seen It is the layer of concentration of carbon that is currently captured in the forest or project in question. Compare the image above with the one below and you can clearly see how the largest amount of carbon is sequestered right where we have the activity tiles.
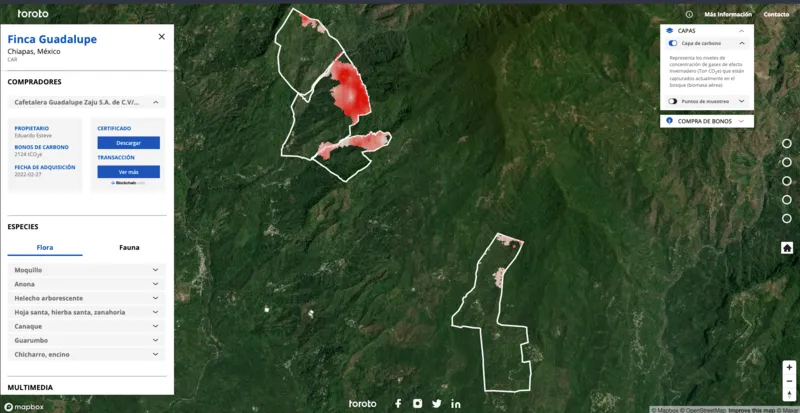
Carbon concentration layer
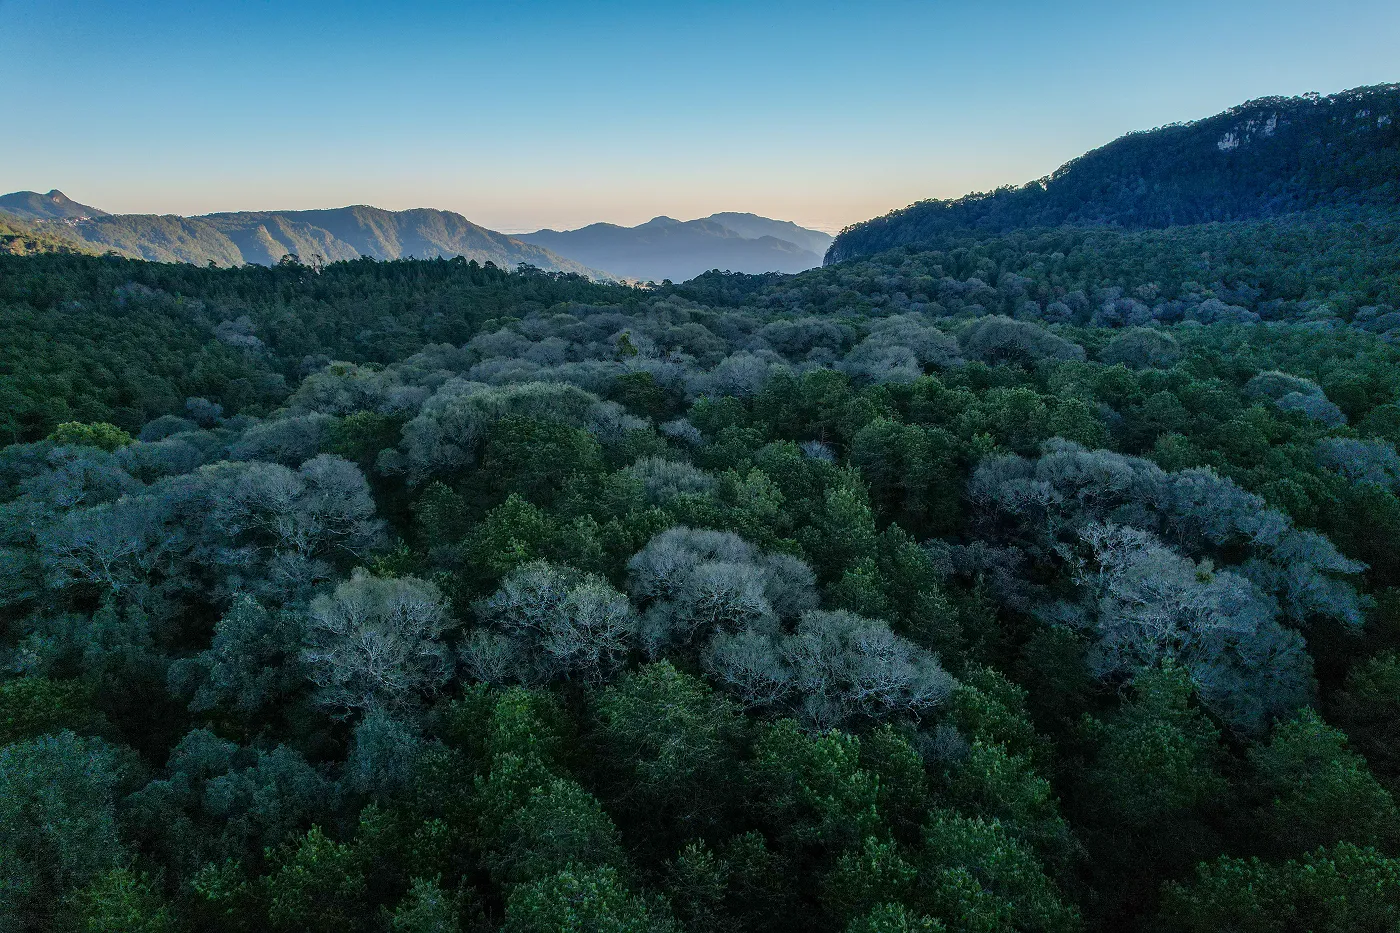
The Metaregistro offers the possibility to view each project in a more complete and comprehensive way, since it allows us to understand in greater depth the region, the surrounding ecosystem and the social and geographical qualities of the town. As we have learned, the solutions to combat climate change have to be round, so we believe that this first version of the Metaregistro is the beginning of a great solution for an even bigger problem.
This platform is yours so that as a buyer, seller or land owner you have all the information you need to make the best decisions regarding your projects. This platform is also for you as an environmentally responsible company, student or simple nature lover, since it works as a good start to comprehensively understand some localities in the country.
If you are a project owner and would like them to be in the Metaregistro, contact us to be able to include your project, it's a completely free platform for everyone!
Let's build a stronger, fairer and more transparent carbon market!
About the author:
María is a Communication Analyst in Toroto. She is passionate about the fight against climate change. He loves how we can learn so much about nature if we just listen to it.

Explore reflections, research and field learning from our work in ecosystem restoration.